
Technically speaking, the major U.S. benchmarks have rallied respectably from the September low, rising in the wake of a damaging market downdraft.
Against this backdrop, the S&P 500 and Dow industrials have reached key technical tests — closely matching the 50-day moving average — areas defining the immediate bull-bear battleground.
Before detailing the U.S. markets’ wider view, the S&P 500’s
SPX,
hourly chart highlights the past two weeks.
As illustrated, the S&P has rallied to challenge the 50-day moving average, currently 3,355.
Monday’s close (3,351.6) registered slightly under the 50-day, and a retest remains underway.
The prevailing upturn punctuates a jagged, but successful, test of major support (3,233).
Similarly, the Dow Jones Industrial Average
DJIA,
has reached a key technical test.
In its case, the 50-day moving average, currently 27,562, closely matches the June peak (27,580). This area is also detailed on the daily chart.
Monday’s close (27,584) effectively matched resistance, and an extended retest remains in play.
Combined, the S&P 500 and Dow industrials have reached notable overhead matching the 50-day moving average.
Meanwhile, the Nasdaq Composite’s
COMP,
backdrop has strengthened slightly versus the other benchmarks.
As illustrated, the index has reclaimed its 50-day moving average, currently 11,043. The upturn snaps a stretch of seven straight closes under the trending indicator.
Slightly more broadly, the prevailing rally punctuates a double bottom — the W formation — defined by the September low (10,519). Thursday’s session low (10,520) matched support.
Widening the view to six months adds perspective.
On this wider view, the Nasdaq is digesting an aggressive September downturn, spanning as much as 12.9% from its record high.
Against this backdrop, the prevailing upturn places the index atop gap resistance (10,974) and the 50-day moving average.
As always, the 50-day moving average is a widely-tracked intermediate-term trending indicator. The reversal higher strengthens the bull case. (The 50-day has marked a September inflection point, initially offering support, then pivoting to resistance.)
Tactically, follow-through atop the mid-September peak (11,245) would mark a “higher high” more firmly neutralizing the September downdraft.
Looking elsewhere, the Dow Jones Industrial Average has also reversed from the September low.
From top to bottom, the index had dropped as much as 2,662 points, or 9.1%, from its seven-month high, established Sept. 3.
Tactically, major resistance closely matches the 50-day moving average, currently 27,562, and the breakdown point (27,580).
Monday’s close (27,584) matched resistance, and a retest remains underway. The Dow’s intermediate-term bias remains bearish-leaning pending material follow-through atop this area.
Meanwhile, the S&P 500 has absorbed a downturn spanning as much as 10.6% from its record peak.
To reiterate, the prevailing upturn places the 50-day moving average, currently 3,355, under siege. Monday’s close (3,351.6) registered nominally lower.
More broadly, the S&P has maintained major support matching the June peak (3,233).
The bigger picture
As detailed above, the major U.S. benchmarks have rallied respectably from the September low.
Against this backdrop, the S&P 500 and Dow industrials are retesting notable resistance matching the 50-day moving average from underneath.
To reiterate, an immediate reversal atop the 50-day — on the first retest — would signal waning selling pressure, strengthening the bull case.
Moving to the small-caps, the iShares Russell 2000 ETF has maintained gap support (141.98).
Recall that last week’s low (142.09) registered fractionally atop support.
More immediately, the small-cap benchmark is pressing resistance matching the July peak (150.20). The prevailing upturn punctuates last week’s whipsaw at the 200-day moving average.
Similarly, the SPDR S&P MidCap 400 ETF has weathered a jagged test of its 200-day moving average, currently 330.64.
Last week’s close (330.75) effectively matched the 200-day, and the MDY has reversed higher this week.
Looking elsewhere, the SPDR Trust S&P 500 has narrowly maintained the June peak (323.41).
The September closing low (323.50), established Thursday, effectively matched support.
More immediately, a retest of the 50-day moving average, currently 335.03, is within view. The week-to-date peak (334.96) has registered nearby.
Beyond technical levels, consider that the September downturns have been fueled by increased volume, and punctuated by lighter-volume rally attempts. Bearish price action.
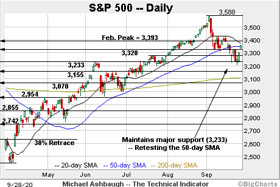
Placing a finer point on the S&P 500, the index has rallied sharply from a jagged, but successful, test of the June peak (3,233).
The reversal places it atop the breakdown point (3,328) raising a question mark. This area “should” have drawn selling pressure if market bears were setting the technical tone.
More immediately, the S&P has initially balked at its 50-day moving average, currently 3,355.
Tactically, a close atop the 50-day — on this week’s first test from underneath — would place the S&P on firmer technical ground.
On further strength, the 20-day moving average, currently 3,366, is followed by the February peak (3,393) and the mid-September range top, circa 3,425.
Eventual follow-through atop the mid-September peak would mark a “higher high” more firmly strengthening the bull case.
As always, it’s not just what the benchmarks do, it’s how they do it.
But generally speaking, a sustained reversal atop the breakdown point (3,328), and the 50-day moving average, would likely neutralize the September downturn. The S&P 500’s intermediate-term bias remains bearish-leaning, based on today’s backdrop, though key technical tests are currently underway.
The quality of the prevailing rally attempt, and the response to the presidential debate, will likely add color.
Also see: Charting a bearish technical tilt: S&P 500, Dow industrials violate major support.
Tuesday’s Watch List
The charts below detail names that are technically well positioned. These are radar screen names — sectors or stocks poised to move in the near term. For the original comments on the stocks below, see The Technical Indicator Library.
Drilling down further, the iShares Japan ETF
EWJ,
is acting well technically. (Yield = 1.9%.)
As illustrated, the shares have rallied to the range top, rising to tag a fractional seven-month closing high. A near-term target projects to the 61 area on follow-through.
Slightly more broadly, the prevailing flag-like pattern is underpinned by trendline support closely matching the former breakout point, circa 58.00. The prevailing uptrend is firmly-intact barring a violation.
Moving to U.S. sectors, the iShares U.S. Home Construction ETF remains a pocket of relative sector strength.
Technically, the group has asserted an orderly September range, digesting a recent rally to record territory.
More immediately, the group has maintained its 50-day moving average, outpacing the major U.S. benchmarks. Tactically, a sustained posture atop the 50-day, and the slightly deeper range bottom (51.70), signals a bullish intermediate-term bias.
Initially profiled July 16, Roku, Inc.
ROKU,
has returned 20.8% and remains well positioned.
Earlier this month, the shares knifed to record highs, rising after the company announced that NBC’s Peacock streaming service will be available on the Roku platform.
The ensuing pullback has been comparably flat, placing the shares 7.8% under the September peak. Tactically, the ascending 50-day moving average, currently 161.30, has marked an inflection point. A posture higher signals a bullish bias.
More broadly, the shares are well positioned on the four-year chart, clearing major resistance to reach previously uncharted territory.
Abercrombie & Fitch Co.
ANF,
is a well positioned small-cap retailer.
The shares initially spiked four weeks ago, gapping higher amid a volume spike after the company’s second-quarter results.
More immediately, the prevailing pullback has been orderly, placing the shares at an attractive entry near the breakout point (14.40) and 7.0% under the September peak.
Also notice the pending golden cross, or bullish 50-day/200-day moving average crossover.
Initially profiled Sept. 2, Anaplan, Inc.
PLAN,
has edged fractionally higher and remains well positioned.
Late last month, the shares gapped sharply higher, rising after the company’s strong quarterly results.
The subsequent pullback has been orderly — amid market volatility — positioning the shares to build on the initial strong-volume spike.
Tactically, the February peak (63.71) marked an all-time high and is currently under siege. An intermediate-term target projects to the 71 area on follow-through.
Finally, Whirlpool Corp.
WHR,
is a large-cap home appliances manufacturer. (Yield = 2.6%.)
As illustrated, the shares have rallied to the range top, rising to tag a fractional two-year closing high. An intermediate-term target projects to the 194 area on follow-through.
Conversely, trendline support roughly tracks the 50-day moving average, currently 173.55. A breakout attempt is in play barring a violation.
More broadly, the shares are well positioned on the three-year chart, rising from a bullish continuation pattern hinged to the early-2020 V-shaped reversal.
Still well positioned
The table below includes names recently profiled in The Technical Indicator that remain well positioned. For the original comments, see The Technical Indicator Library.
| Company | Symbol* (Click symbol for chart.) | Date Profiled |
| American Eagle Outfitters | AEO | Sept. 28 |
| Twitter, Inc. | TWTR | Sept. 28 |
| Blueprint Medicines Co. | BPMC | Sept. 28 |
| Zendesk, Inc. | ZEN | Sept. 23 |
| Datadog, Inc. | DDOG | Sept. 23 |
| Scientific Games Corp. | SGMS | Sept. 23 |
| Maxar Technologies, Inc. | MAXR | Sept. 18 |
| V.F. Corp. | VFC | Sept. 14 |
| Crocs, Inc. | CROX | Sept. 14 |
| Toyota Motor Co. | TM | Sept. 14 |
| Five Below, Inc. | FIVE | Sept. 10 |
| Dow Inc. | DOW | Sept. 10 |
| Eastman Chemical Co. | EMN | Sept. 10 |
| CrowdStrike Holdings, Inc. | CRWD | Sept. 9 |
| Workhorse Group, Inc. | WKHS | Sept. 9 |
| International Paper Co. | IP | Sept. 3 |
| Anaplan, Inc. | PLAN | Sept. 2 |
| Beyond Meat, Inc. | BYND | Sept. 1 |
| Elastic N.V. | ESTC | Sept. 1 |
| Medtronic | MDT | Aug. 28 |
| Celanese Corp. | CE | Aug. 26 |
| Norfolk Southern Corp. | NSC | Aug. 25 |
| Westlake Chemical Corp. | WLK | Aug. 25 |
| Deere & Co. | DE | Aug. 24 |
| PulteGroup, Inc. | PHM | Aug. 24 |
| Expedia Group, Inc. | EXPE | Aug. 24 |
| Johnson Controls International | JCI | Aug. 21 |
| Adobe, Inc. | ADBE | Aug. 20 |
| Canadian Solar, Inc. | CSIQ | Aug. 20 |
| General Motors Co. | GM | Aug. 20 |
| Starbucks Corp. | SBUX | Aug. 18 |
| Builders FirstSource, Inc. | BLDR | Aug. 18 |
| Steel Dynamics, Inc. | STLD | Aug. 17 |
| Elanco Animal Health, Inc. | ELAN | Aug. 17 |
| Brinker International, Inc. | EAT | Aug. 13 |
| Enphase Energy, Inc. | ENPH | Aug. 13 |
| Nike, Inc. | NKE | Aug. 11 |
| Nucor Corp. | NUE | Aug. 11 |
| Freeport McMoRan, Inc. | FCX | Aug. 10 |
| Natera, Inc. | NTRA | Aug. 10 |
| Lennar Corp. | LEN | Aug. 7 |
| McDonald’s Corp. | MCD | Aug. 7 |
| Mastercard, Inc. | MA | Aug. 6 |
| Kansas City Southern | KSU | Aug. 6 |
| Industrial Select Sector SPDR | XLI | Aug. 6 |
| Verizon Communications, Inc. | VZ | Aug. 5 |
| Sunrun, Inc. | RUN | Aug. 5 |
| Penn National Gaming, Inc. | PENN | July 30 |
| Procter & Gamble Co. | PG | July 29 |
| SPDR S&P Metals & Mining ETF | XME | July 28 |
| iShares MSCI South Korea ETF | EWY | July 28 |
| Toll Brothers, Inc. | TOL | July 27 |
| Advanced Micro Devices, Inc. | AMD | July 23 |
| Best Buy Co., Inc. | BBY | July 22 |
| Materials Select Sector SPDR | XLB | July 20 |
| Caterpillar, Inc. | CAT | July 20 |
| iShares U.S. Home Construction ETF | ITB | July 17 |
| Progressive Corp. | PGR | July 17 |
| Livongo Health, Inc. | LVGO | July 17 |
| Roku, Inc. | ROKU | July 16 |
| Cognizant Technology Solutions, Inc. | CTSH | July 16 |
| Consumer Staples Select Sector SPDR | XLP | July 15 |
| Home Depot, Inc. | HD | July 15 |
| Costco Wholesale Corp. | COST | July 15 |
| Air Products & Chemicals, Inc. | APD | July 14 |
| Consumer Discretionary Select Sector SPDR | XLY | July 13 |
| SunPower Corp. | SPWR | July 13 |
| Walmart, Inc. | WMT | July 8 |
| Big Lots, Inc. | BIG | July 1 |
| Tandem Diabetes Care, Inc. | TNDM | July 1 |
| Dell Technologies, Inc. | DELL | June 30 |
| Danaher Corp. | DHR | June 24 |
| RH | RH | June 24 |
| Lowe’s Companies | LOW | June 19 |
| Fiverr International, Ltd. | FVRR | June 19 |
| Etsy, Inc. | ETSY | June 17 |
| HubSpot, Inc. | HUBS | June 8 |
| Square, Inc. | SQ | June 8 |
| United Parcel Service, Inc. | UPS | June 5 |
| FedEx Corp. | FDX | June 3 |
| SPDR S&P Retail ETF | XRT | June 3 |
| iShares MSCI Japan ETF | EWJ | May 29 |
| SolarEdge Technologies, Inc. | SEDG | May 29 |
| Synopsis, Inc. | SNPS | May 27 |
| Agilent Technologies, Inc. | A | May 15 |
| Qualcomm, Inc. | QCOM | May 12 |
| Salesforce.com, Inc. | CRM | May 8 |
| Facebook, Inc. | FB | May 7 |
| Spotify Technology S.A. | SPOT | May 5 |
| Dollar General Corp. | DG | Apr. 28 |
| ServiceNow, Inc. | NOW | Apr. 27 |
| Five9, Inc. | FIVN | Apr. 24 |
| Chewy, Inc. | CHWY | Apr. 24 |
| Tesla, Inc. | TSLA | Apr. 23 |
| VanEck Vectors Semiconductor ETF | SMH | Apr. 17 |
| Veeva Systems, Inc. | VEEV | Apr. 17 |
| Okta, Inc. | OKTA | Apr. 16 |
| Target Corp. | TGT | Apr. 16 |
| Invesco QQQ Trust | QQQ | Apr. 14 |
| DocuSign, Inc. | DOCU | Apr. 3 |
| Zscaler, Inc. | ZS | Apr. 3 |
| Apple, Inc. | AAPL | Mar. 27 |
| Nvidia Corp. | NVDA | Mar. 27 |
| Zoom Video Communications, Inc. | ZM | Mar. 19 |
| iShares MSCI Emerging Markets ETF | EEM | Mar. 19 |
| SPDR Gold Shares ETF | GLD | Jan. 2 |
| Microsoft Corp. | MSFT | Feb. 22 |
| * Click each symbol for current chart. |